
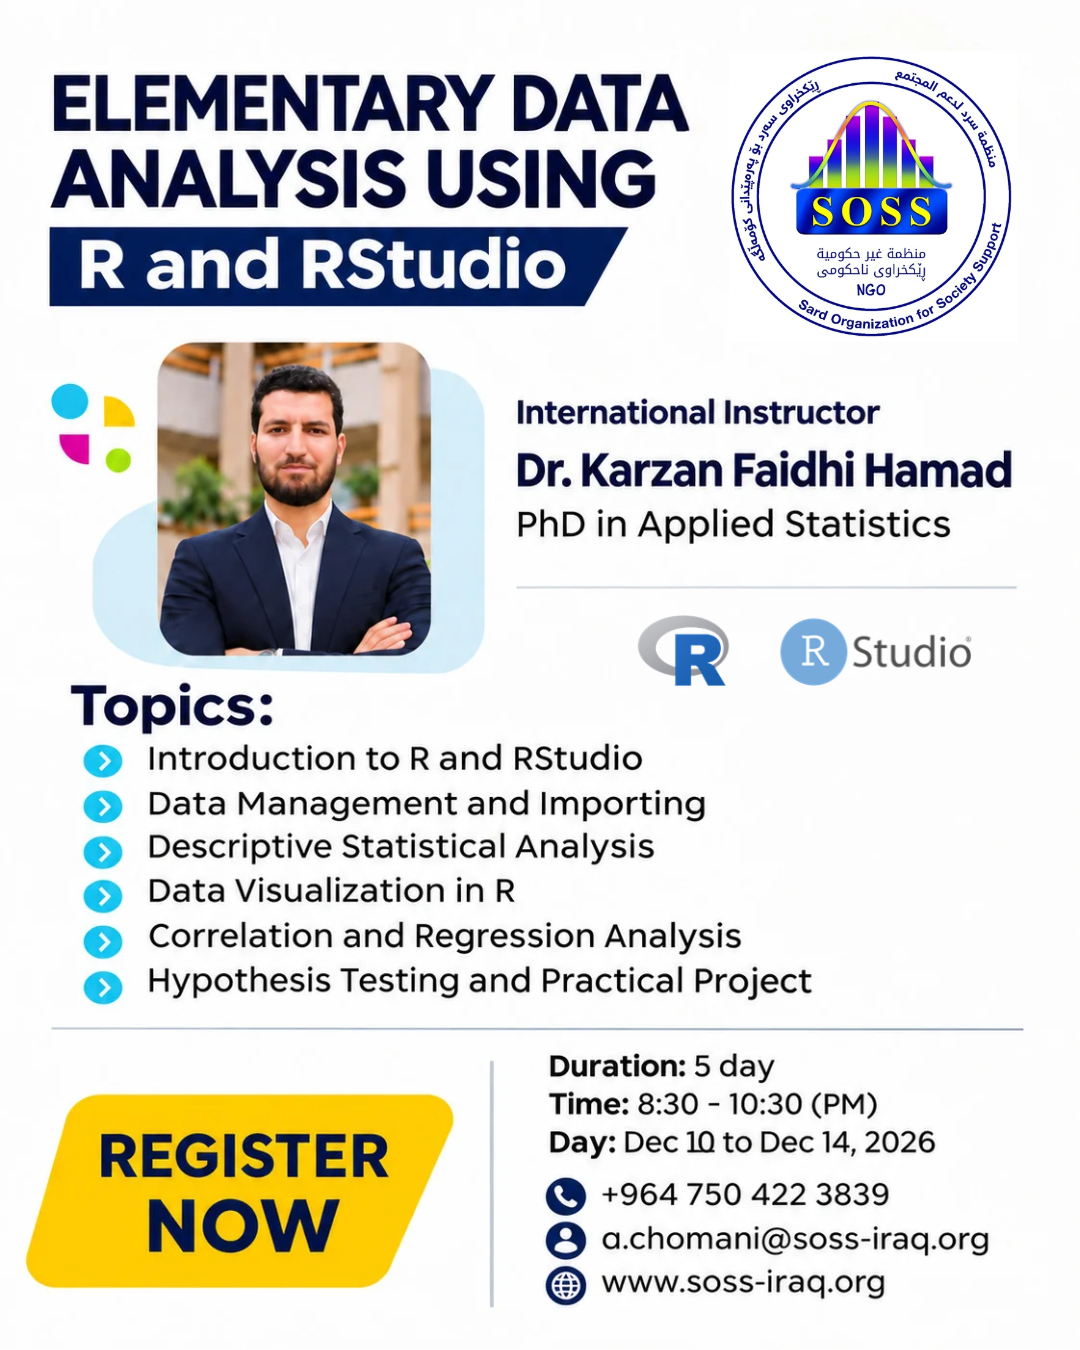
Elementary Data Analysis Using R and RStudio
Course Overview
Sard Organization offers a hands-on introduction to R. Participants start by running their first command in RStudio and finish by analyzing a real dataset and presenting their findings in a plot. When you open an Excel file in R, how can you tell whether a column contains numbers or text? What happens to an average when some entries are missing? Participants work through questions like these by inspecting a data frame, running commands and checking the results against the original observations.
Course Objective
Learn to import a dataset, summarize it with tables and graphs, and interpret the results of a statistical test. By the final session, participants should be able to choose a histogram to show how values are distributed or a scatterplot to examine the relationship between two numerical variables. In the mini-project, they explain what their chosen plot reveals about the data.
Main Topics
Day 1 — Introduction to R and RStudio: Install R and RStudio, run commands in the console, and work with variables, data types, vectors, and matrices.
Day 2 — Data Import and Management: Import CSV and Excel files, inspect a data frame, select columns, and filter rows.
Day 3 — Descriptive Statistics: Describe the center and spread of a distribution, build frequency tables, and handle missing values.
Day 4 — Data Visualization: Create scatterplots, histograms, and boxplots in R, then explore how ggplot2 builds plots in layers.
Day 5 — Statistical Analysis and Practical Application: Compare means with one- and two-sample t-tests and examine relationships using correlation and simple linear regression. Apply these skills to a real dataset in a final mini-project.
Who Is This Course For?
Students, researchers and first-time R users who want practical experience analyzing data. The exercises are especially relevant if you already record research data in Excel and want to compare two groups or explore how two measurements vary together. The first lesson starts with a single command, so beginners can follow the analysis from the beginning.
Course Duration and Schedule
December 10–14, 2026, from 8:30 to 10:30 PM each evening. Five sessions, ten training hours in total. The first three evenings cover commands, data tables and descriptive statistics. The last two bring those skills together through visualization, statistical tests and the final mini-project.
Course Trainer
Dr. Karzan Faidhi Hamad is an international instructor with a PhD in Applied Statistics and a master’s degree in Statistics. His studies include R programming for bioinformatics. He ranked third in his graduating class when he earned his bachelor’s degree in Statistics. His study of bioinformatics is one example of how R can be applied to biological data.
Participation Requirements
For the practical exercises, use a laptop or desktop computer on which you can install R and RStudio. The first lesson covers installation of both programs. To prepare, check that you can install software on your computer and save the scripts and datasets you will use during the exercises.
Information and Registration
Contact us on WhatsApp at: 07504223839
Or click the link below and complete the registration form:
Click here to fill out the registration form